Explainability in Data Science:- Data, Model & Prediction
XAI( Explainable AI ) is grabbing lime-light in machine learning. How can we be sure that image classification algo is learning faces not background ? Customer wants to know why loan is disapproved? Globally important variable might not be responsible/ imp for individual prediction. Here XAI comes to rescue-
We have taken data from classification_data
This has some sensor values and an output class.
A) Data Explainability- what are the basic understanding required from data perspective.
1) Identify missing values, co-linear
feature, feature interaction, zero importance feature, low important feature,
single value feature and handle missing values, remove/ handle features
accordingly.
2) Missing values- no missing values from
data description
3) No good correlation between variables-
can be seen from correlation plots
5) Zero importance, low importance,
single feature value- handles through RFE and models( RF, XGboost) itself.
6) Distribution and sampling of both the
class and features is also seen as selection of model will depend of data
distribution. Chances are data with lot of categorical variables is more
suitable for tree based model.
7) Box plot itself can identify important
feature for classification. We can see sensor 3, 8, 6 looks important whereas 5,
7 may not have good prediction power.
B) Other Approaches- Feature
selection/engineering-
2) Recursive feature Engineering RFE- select n specific features based on underlying model
used. ( used)
4)
Autoencoders- non linear transformation of features if
needed ( it will be
over-kill here)
5) Feature importance by Random forest,
DT( In terms of rules), other tree ensemble models like Catboost and Xgboost.-
used on our scenario
C) Feature Importance
on sensor data ( Global)- In practical I take features
importance from the domain / business people,
as in our scenario sensor 7 ( one of the least important feature) might
be electric current in steel mixture plant and to see impact of current in
anomalies/fault it has to be on higher sampling( micro/ mili seconds) unlike
temperature. Thus we will be missing an important feature as data collection
rate is not correct. Such understanding can only come from domain experts. So
business understanding and ML both are equally important for feature
engineering.
There are
white box models like DT and Random Forest to get feature importance from model
itself. In our case we have taken coefficient of logistic regression in the
beginning.( see all the algos comparison at github- link Here we are relying on the models that have maximum accuracy - RF and xgboost.
Thus over all
we can say that feature- 8,6, 4, 0, 1,3 looks important for classification
model. Feature 7 seems having no importance in xgboost as its classification
power is captured by other feature. This Important of features was visible in
box-plot also.
Recursive
feature Elimination is useful in selecting subset of features as it tells top
feature to keep for modeling.
D) Feature Importance
on sensor data ( Local)-
With the
advancement of ML and Deep learning, just global importance is not useful. Business,
Data scientist are looking for local explanation too. In our analysis, we have
used IBM AIX 360 framework to get importance of rules on the features(
importance of feature based on the values of feature and output value). The
options to use different packages/framework are-
AIX360
|
|
Skater
|
|
ELI5
|
|
Alibi
|
|
H20
|
|
MS Azure Explainability
|
|
DALEX
|
The above
image shows feature 8 is most important over-all but when it comes to specific
predictions. Subset of feature 6 seems more importance for many predictions. We
can get good insights from such rules like- sensor 6 in 1 st and 4th
quadrant has less importance compare to very strong importance in quadrant 2
and 3. If we know the exact feature name we can get lot of valuable insights.
F) SHAP Values explanation-
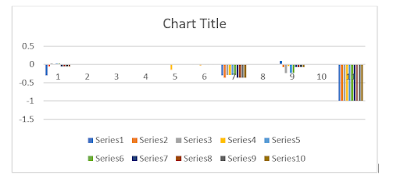
In above plot
10 data points from class 1 is selected, we can clearly see for these data
points 6 is more important and importance of 8 is changing based on values of
features. At the same time feature 1,2,3,5,7, are almost not useful at all for
the prediction. ( 1 Series represents 1 observation)

Above plot has
10 observations from class -1. It shows that for class -1 , feature 0 is also
important for few predictions and instead of 8 and 6, 7 and 9 are more
important.
Such finding
are more important when we have scenarios like multiple fault prediction,
anomalies classification I industrial applications. Once we know the actual
name of signals we will get very insightful information.
Above plot
shows how signal 6 is mostly useful in prediction but there are many instances
when it has no importance on predicted value. Also feature 6 has more
classifying power for class 1 rather than -1. Similar analysis can be done on
other features for better and exhaustive understanding of features- importance.
Detailed code is present on Github- link to github code


Comments
Post a Comment